


Precise Determination of Thermal Conductivity in Pouch-Cell Li-ion Batteries
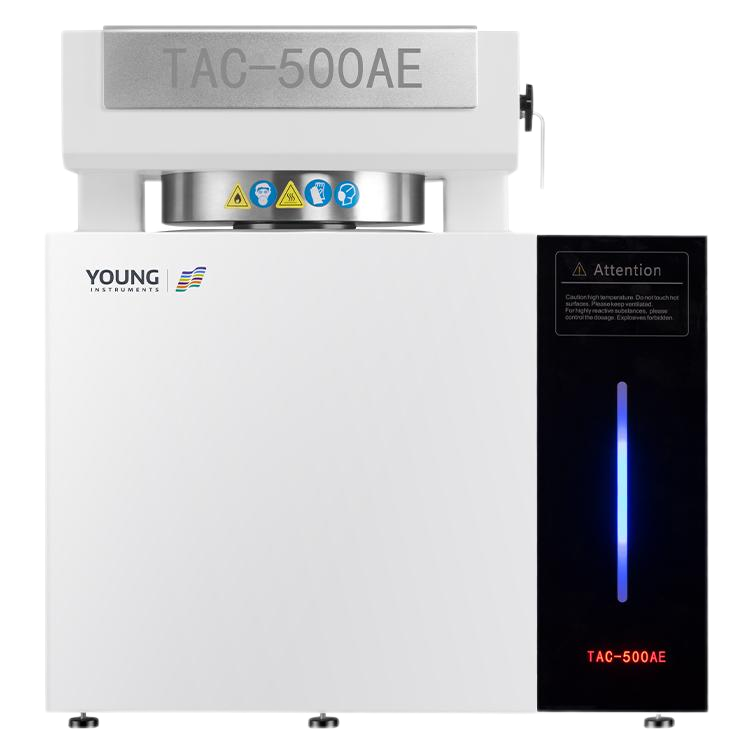
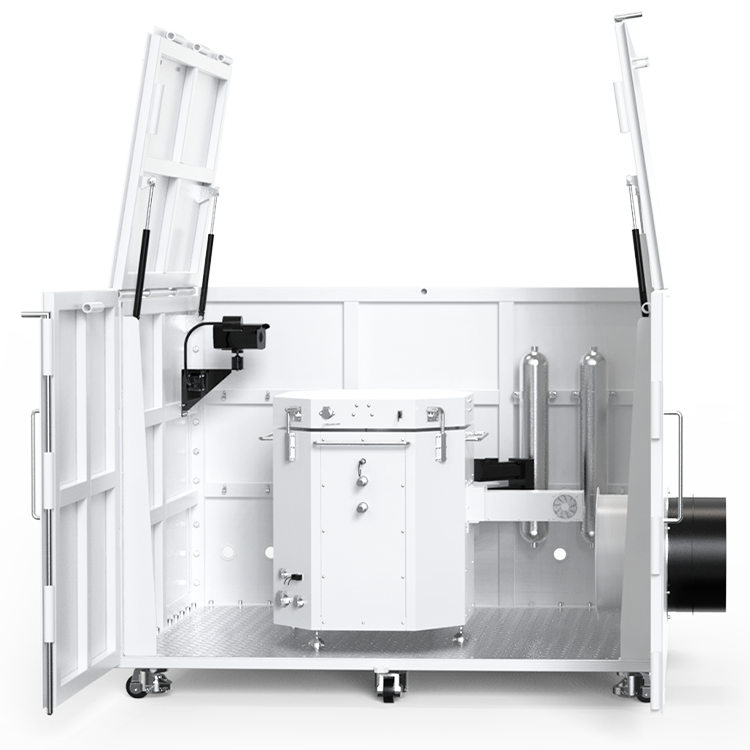
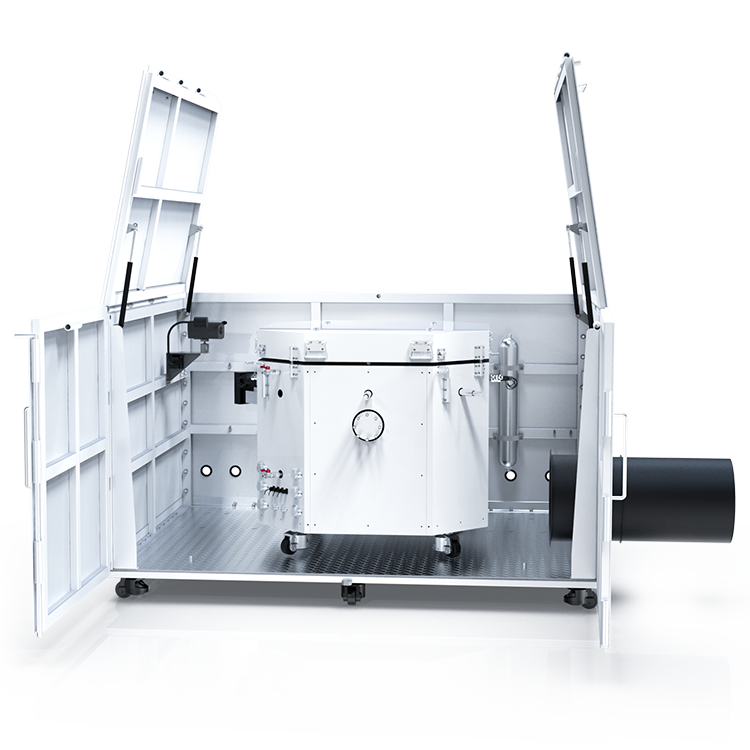
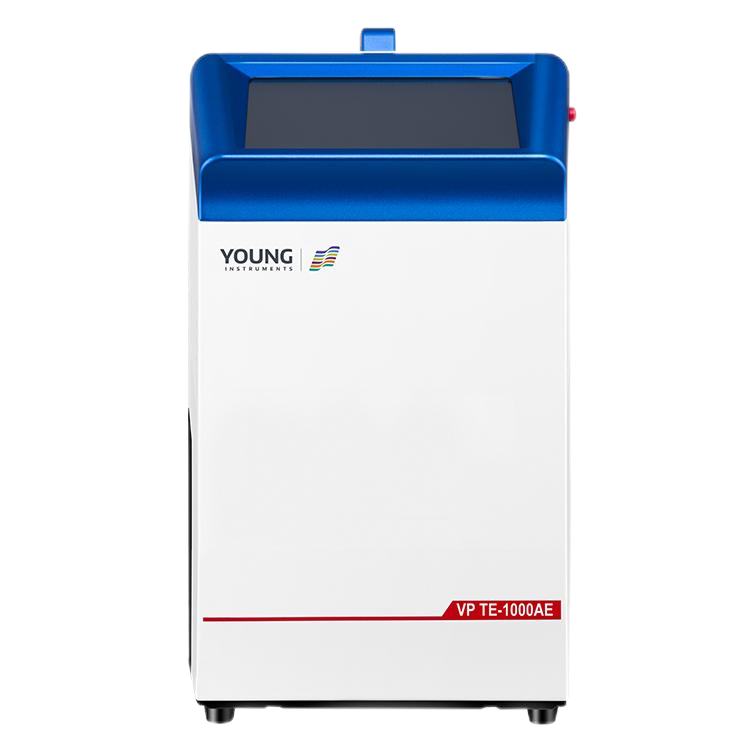
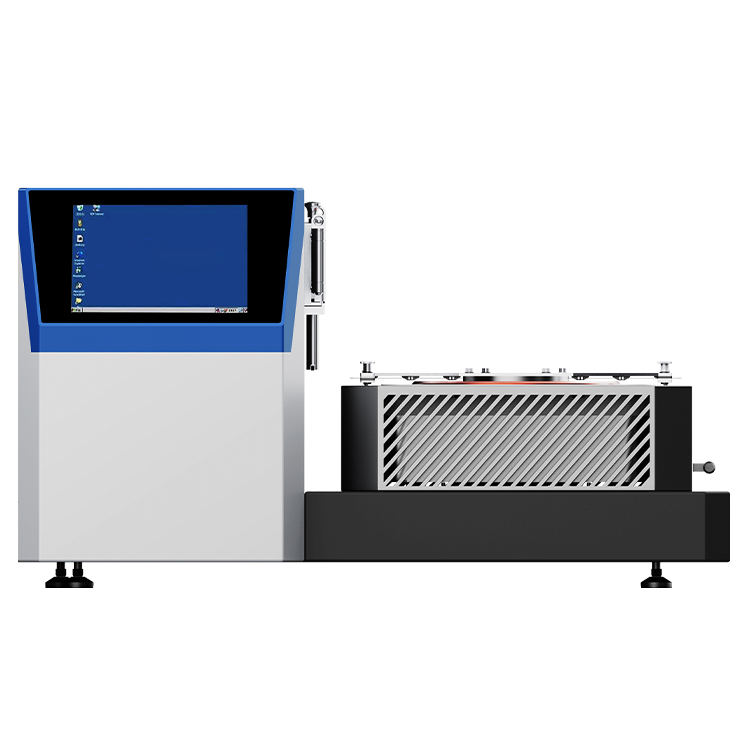
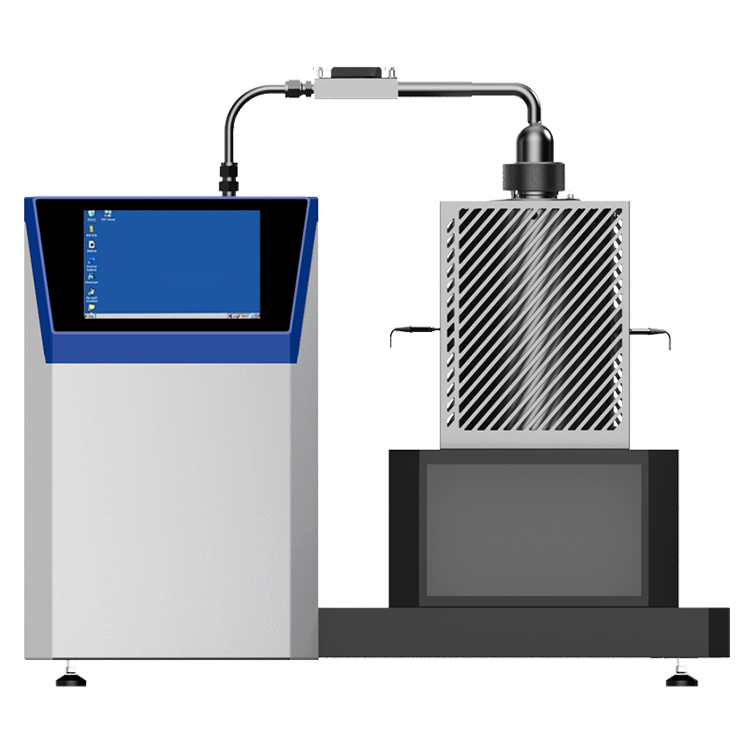
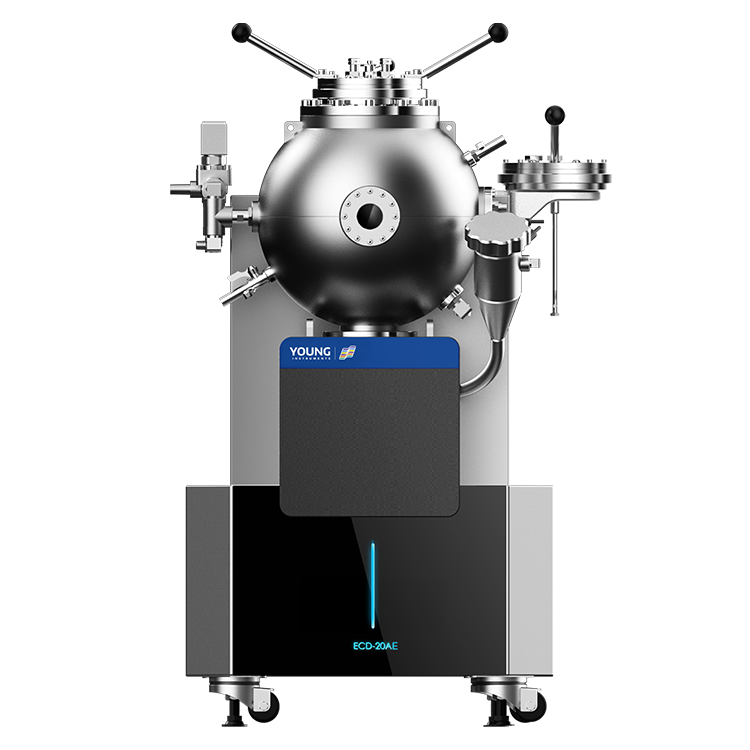
The 3D Thermal Property Analyzer is an original instrument whose working principle is based on infrared thermography and 3D thermal data inversion technology. As shown in Figure 1, during testing, a flexible heating film is attached to the bottom of the pouch cell battery to apply a pulsed thermal excitation. An infrared camera is used to perform non-contact temperature measurement on the battery’s top surface, recording the spatial distribution and temporal evolution of the temperature. By combining the temperature data with a 3D numerical heat transfer model of the test object, the thermal parameters are inversely calculated using an intelligent optimization algorithm. This process simultaneously determines the in-plane and through-plane thermal conductivities (kx, kz) by minimizing the error between the model predictions and the experimental data.
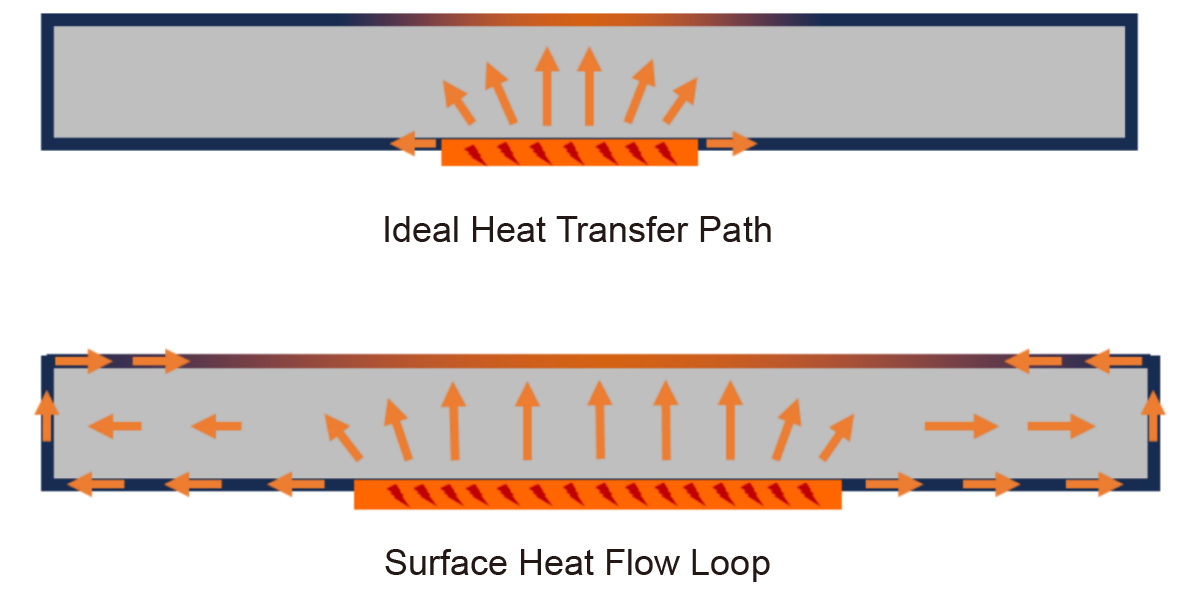
The confidence level of the test results depends on the agreement between the actual heat transfer path within the sample and the numerical model. This agreement can be qualitatively assessed using the error curve generated during the inversion process. A characteristic “V”-shaped error curve is observed; a sharper “V” indicates higher confidence in the measured result, meaning the observed temperature is more sensitive to deviations in the thermal conductivity. Under ideal conditions, as shown in Figure 2, the heat flux from the heater penetrates through the cell core to the top surface. However, issues such as an ill-fitting heating film or inappropriate parameter settings can compromise accuracy. Firstly, a non-negligible heat flux component may travel along the pouch laminate, creating a surface heat flow loop that deviates from the computational model. Secondly, if the temperature rise on the observed surface is too small, random errors from temperature noise become significant, leading to reduced measurement precision.
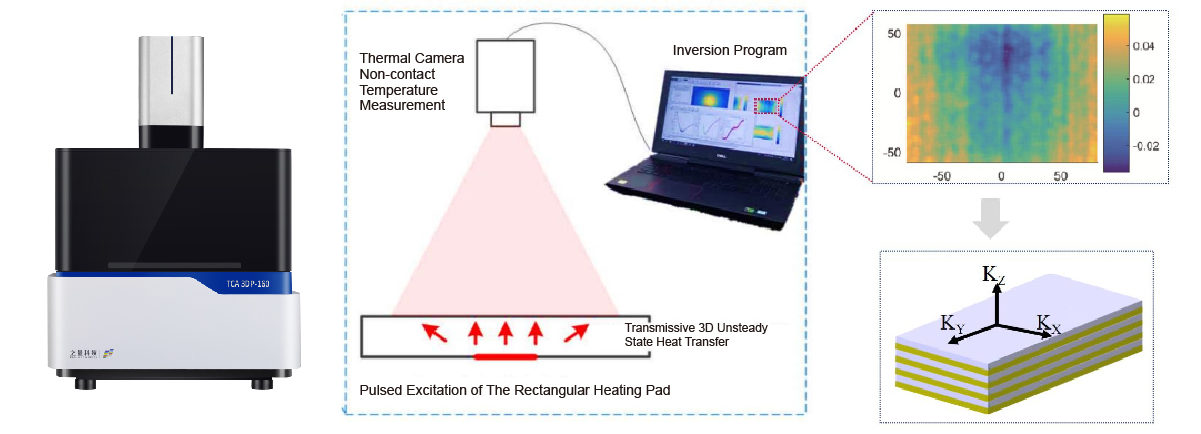
Left: Instrument appearance; Middle: Schematic diagram of the testing principle; Right: Prediction error and the error curve
Based on the measurement principle described above, an ideal thermal excitation source should feature a compact heating area and high power output. Furthermore, heating parameters such as duration and cycle must be appropriately matched to both the sample and the heater’s characteristics. This article selects three typical sample sizes, focusing on the selection of heating films and the design of heating schemes. Combined with specific application examples, it aims to assist users in obtaining more reliable test data.
Sample Preparation
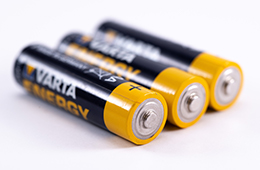
As shown in Figure 3, this study selected three samples for testing: two energy storage batteries and one mobile phone battery. These samples are representative in terms of their dimensions: the 15 Ah energy storage battery represents a conventional size, the 25 Ah energy storage battery has a greater thickness, and the 3.5 Ah mobile phone battery features a compact size, requiring the selection of heating films of different specifications based on these dimensional characteristics. Detailed sample information is listed in Table 1.
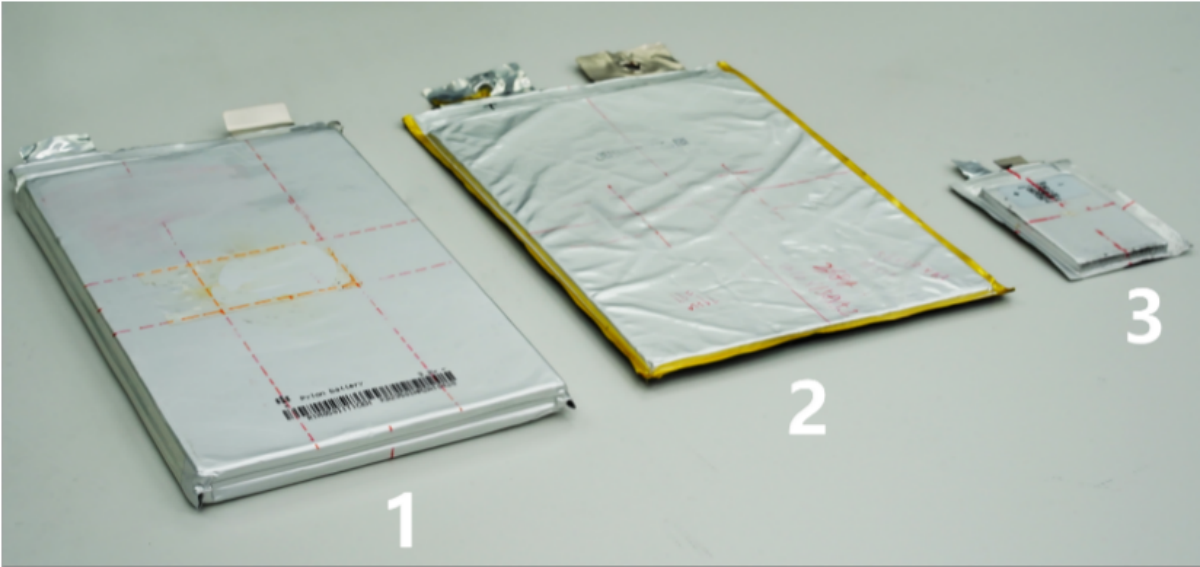
| Serial Number | Sample Name | Sample Size/mm | Heating Piece Size/mm |
| 1 | 25Ah Soft-pack Lithium Battery | 222*138*19.3 | 29*23 |
| 2 | 15Ah Soft-pack Lithium Battery | 227*170*9.5 | 54*36 |
| 3 | 35Ah Soft-pack Lithium Battery | 68.5*48*5.8 | 6*3 |
Sample Testing
Testing of the 15 Ah Pouch-Cell Battery
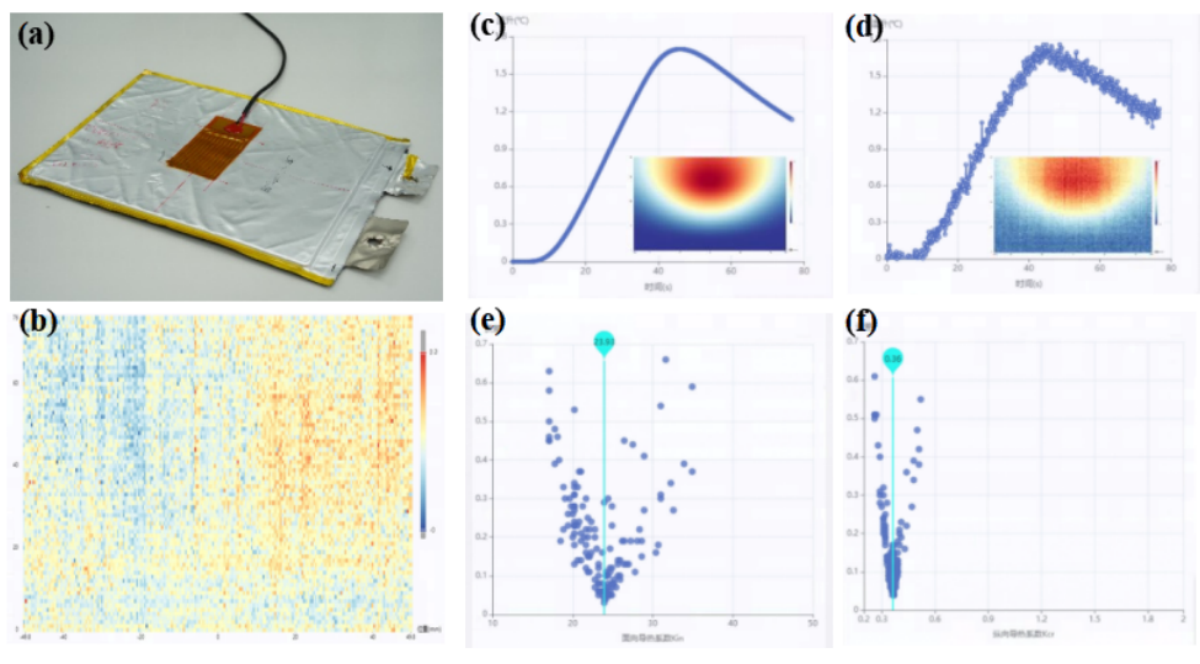
This sample represents a typical pouch cell size. Due to its high length-to-thickness ratio (>20), heat can rapidly penetrate the battery, causing the center point temperature to rise quickly and generating a significant temperature gradient on the top surface. Therefore, while ensuring adequate signal quality, the heating power can be appropriately reduced or the heating duration shortened to minimize the lateral spread of heat across the large surface area, thereby avoiding the influence of lateral heat flow loops. This experiment used the standard heating film supplied with the instrument, measuring 54 mm × 36 mm. The applied heating protocol was: heating power 8 W, heating time 30 s, and a single heating cycle.
This testing protocol yielded satisfactory results. As shown in Figure 4, the predicted temperature data show excellent agreement with the measured values, with the prediction error on the observed surface controlled within 0.12℃. Furthermore, observing Figures 4e and 4f, the error curves for both the in-plane and through-plane thermal conductivities exhibit sharp V-shapes, indicating high confidence in the test results. The optimized calculation results are kx = 23.93 W/(m·K) and kz = 0.36 W/(m·K).
Testing of the 25 Ah Pouch-Cell Battery
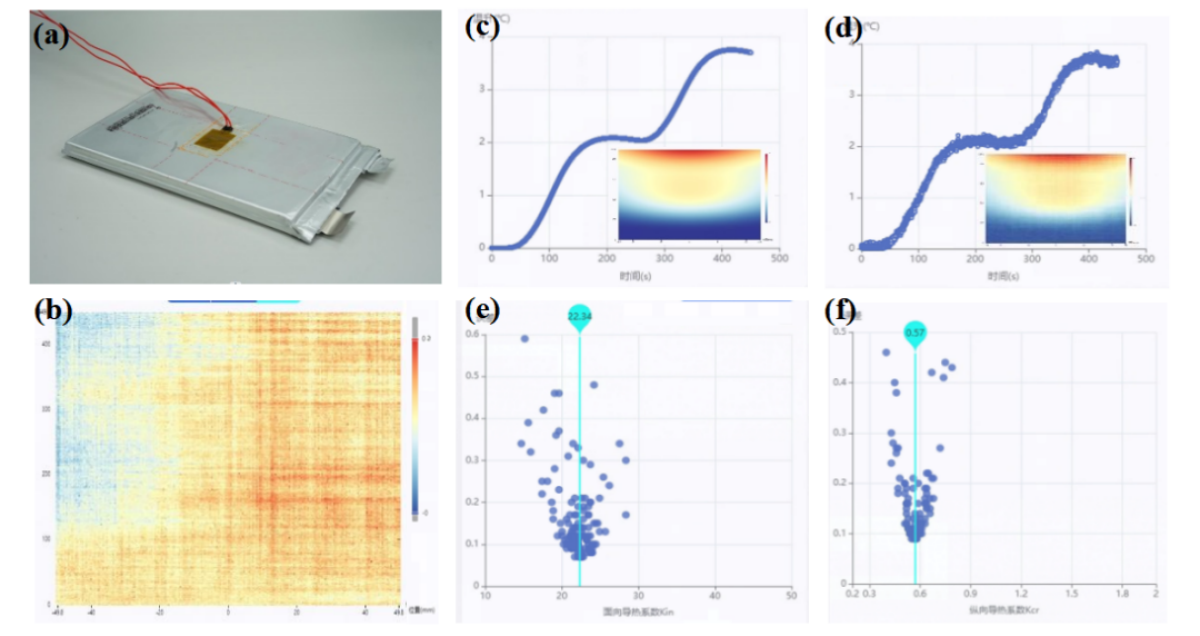
This sample is thicker than conventional cells, with a length-to-thickness ratio of only 11.5. Compared to Sample 1, establishing a sufficient temperature gradient on the observed surface requires a longer heating duration and higher heating power. However, this also increases susceptibility to lateral heat flow loops. To mitigate this issue, the heating film selected for this experiment was designed for higher power density and had a reduced size (29 mm × 23 mm) compared to the standard version. The heating protocol was: heating power 28 W, heating time 75 s, cooling time 150 s, and 2 heating cycles.
This testing protocol successfully balanced measurement accuracy and precision. As shown in Figure 5, the prediction error on the observed surface was controlled within 0.2℃. Furthermore, the error curves for both the in-plane and through-plane thermal conductivities indicate a high level of confidence in the results, which were determined to be kₓ = 22.34 W/(m·K) and k_z = 0.57 W/(m·K).
Testing of the 3.5 Ah Small Pouch-Cell Battery
Due to its small size and a similarly low length-to-thickness ratio of only 11.8 (comparable to Sample 2), a heating film with high power density and the smallest possible size was required. The heating film selected for this experiment measured 6 mm × 3 mm. The applied heating protocol was: heating power 4 W, heating time 10 s, and a single heating cycle.
As shown in Figure 6, the prediction error on the observed surface was controlled within 0.15℃ using this protocol. The small size of the heating film and the short heating duration effectively restricted lateral heat spread. Concurrently, the relatively high power density ensured a sufficient temperature rise amplitude on the observed surface. Consequently, Figures 6e and 6f also indicate high confidence in the test results. The optimized calculation results are kx = 25.91 W/(m·K) and kz = 0.91 W/(m·K).

Summary
The 3D Thermal Property Analyzer provides an accurate and efficient solution for determining the thermal conductivity of pouch-cell lithium-ion batteries. Well-designed testing protocols further enhance the accuracy and precision of the results. To meet user requirements, Zeal Instruments supplies heating elements in various specifications and has developed an intelligent recommendation algorithm for heating protocols. This algorithm automatically suggests appropriate experimental parameters based on sample characteristics, significantly reducing operational complexity and ensuring user-friendly instrument operation.

