


Accelerating Rate Calorimeter for Studying the Thermal Stability of Battery Materials
Due to the high energy density of lithium-ion batteries and the self-reactive nature of battery materials, cells under abuse conditions are prone to unpredictable exothermic and gas generation behaviors, which may lead to severe consequences such as thermal runaway, fire, or explosion. Therefore, when developing new battery systems—especially those designed for high energy density and long cycle life—it is essential to thoroughly evaluate the thermal stability of battery materials and refine their formulations accordingly to enhance safety. Thermal analysis and calorimetry serve as primary methods for assessing the thermal stability of battery materials, enabling the determination of thermodynamic and kinetic parameters associated with their thermal decomposition reactions.
Currently, the main testing methods for evaluating the thermal stability of battery materials include the following two approaches:
- DSC (Differential Scanning Calorimetry)
This method measures the power or temperature difference per unit time between the sample and a reference material under programmed temperature control to determine the heat release rate of the sample as a function of temperature. While it offers high accuracy for homogeneous systems using milligram-level samples, its results may lack statistical significance for heterogeneous systems such as mixtures of electrode materials and electrolytes.
- ARC (Accelerating Rate Calorimetry)
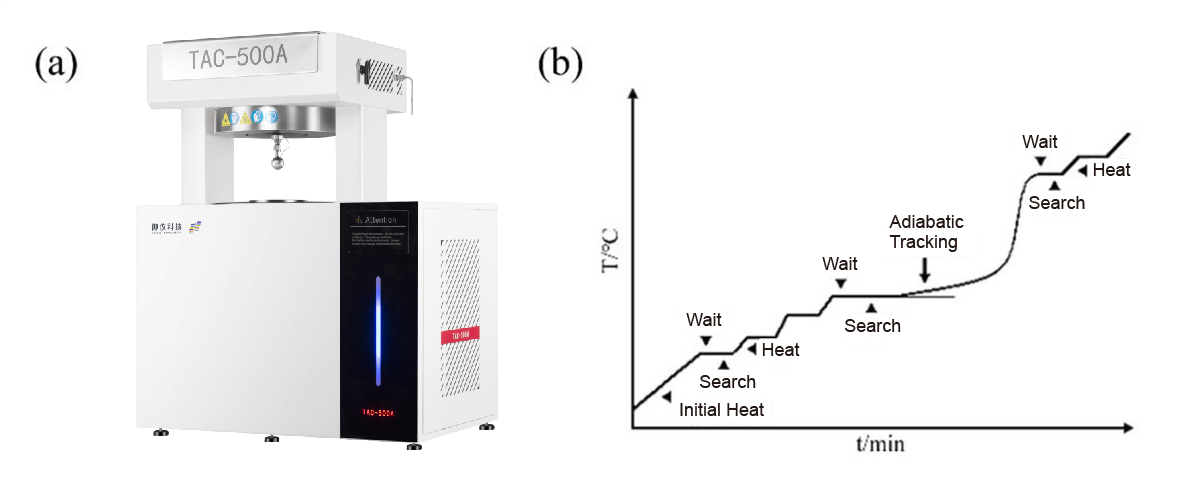
This technique measures the temperature rise rate of a sample under adiabatic conditions, calculating the heat release rate based on the adiabatic temperature increase per unit time. As a gram-scale testing method, it is more suitable for assessing heterogeneous samples. In this study, the classic HWS mode of an Accelerating Rate Calorimeter was used to determine characteristic parameters of the thermal decomposition reactions of battery materials. Based on the Arrhenius equation, the reaction kinetics parameters were fitted. The resulting data can support battery design and system-level thermal simulations, thereby improving the thermal safety performance of battery systems.
Experimental Conditions
- Experimental samples: medium-nickel cathode material at 50% SOC, high-nickel cathode material at 50% SOC, and electrolyte (EC + DMC + LiPF₆)
- Note: The cathode materials were scraped from batteries charged to 50% SOC in a glove box.
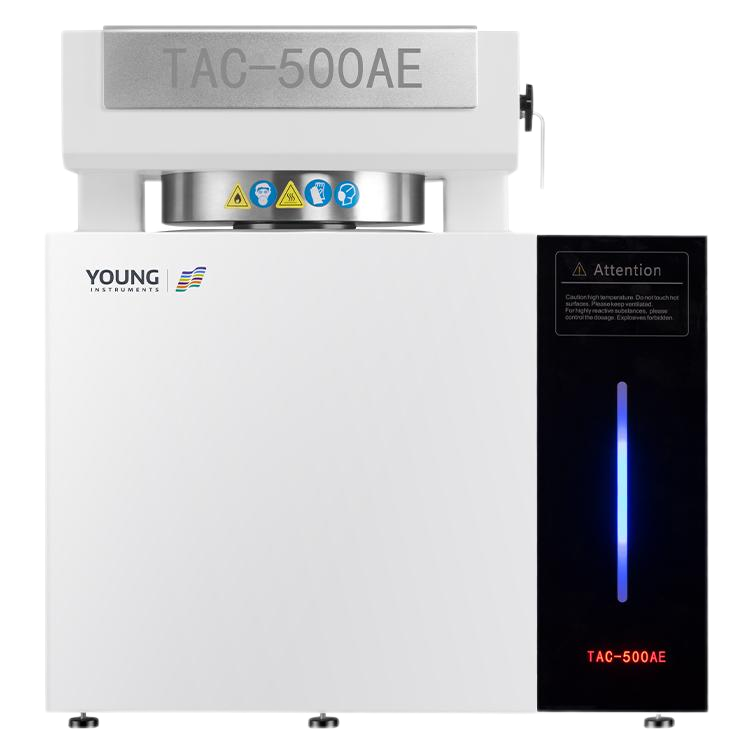
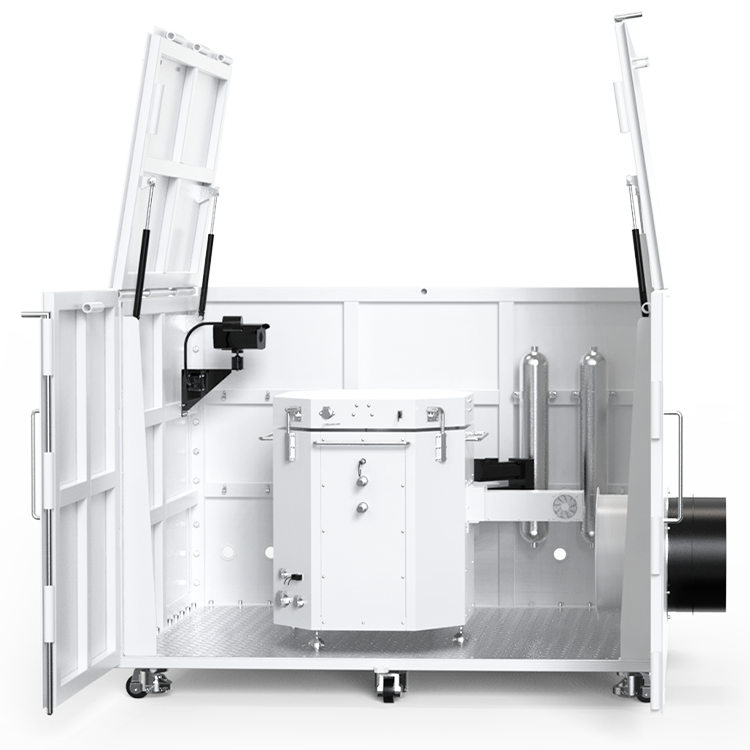
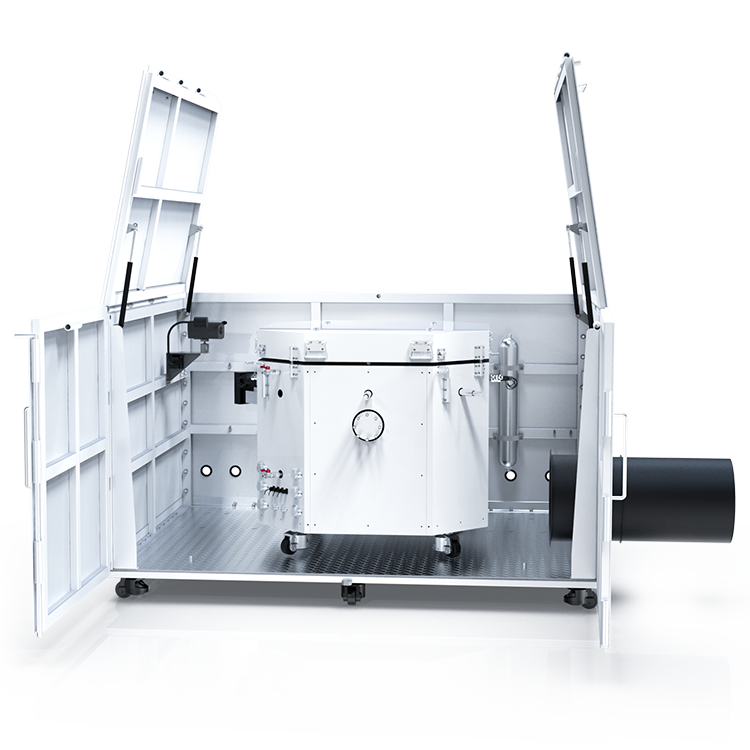
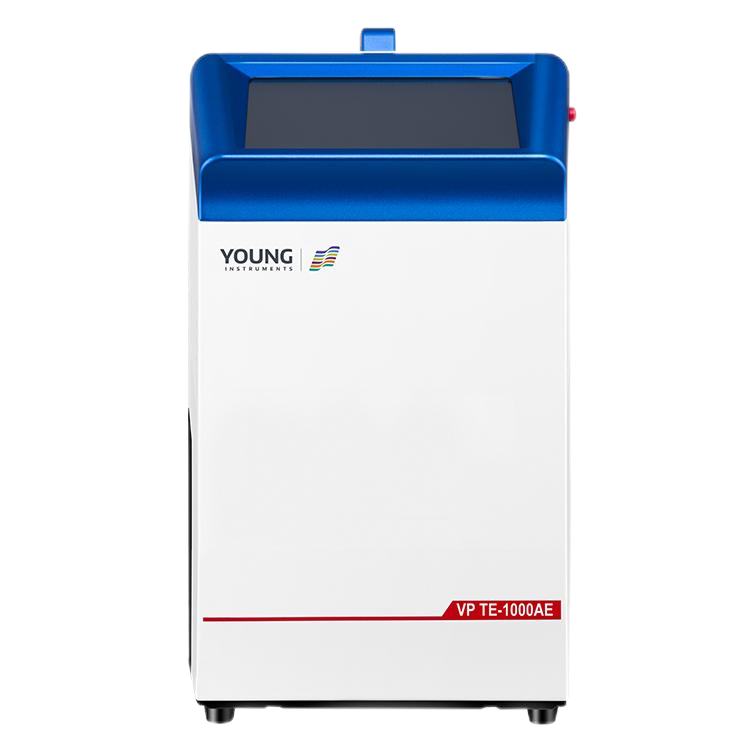
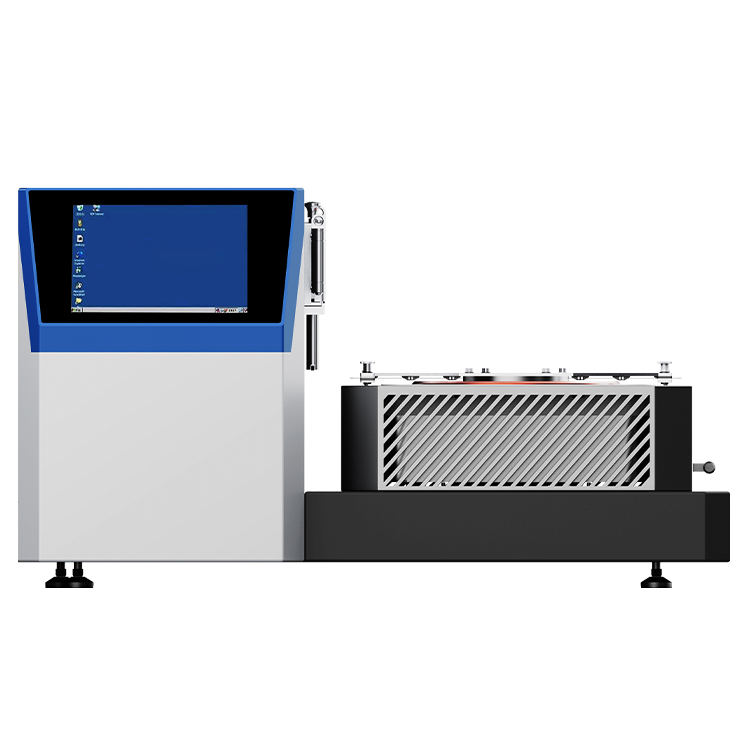
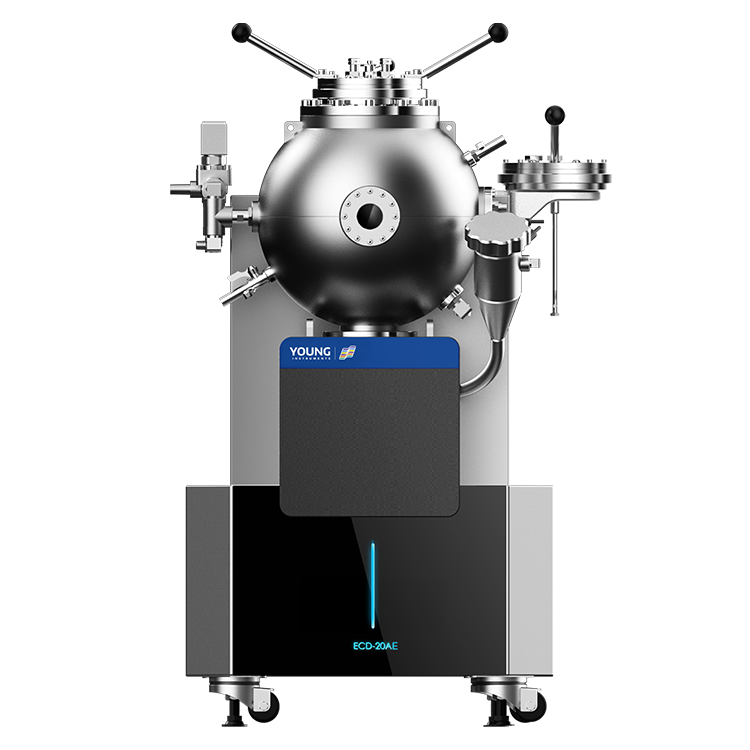
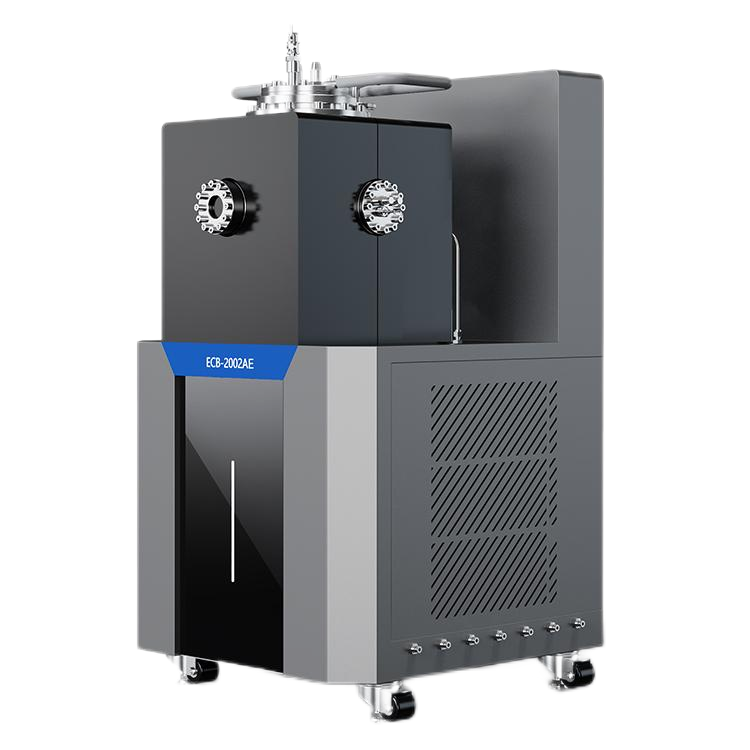
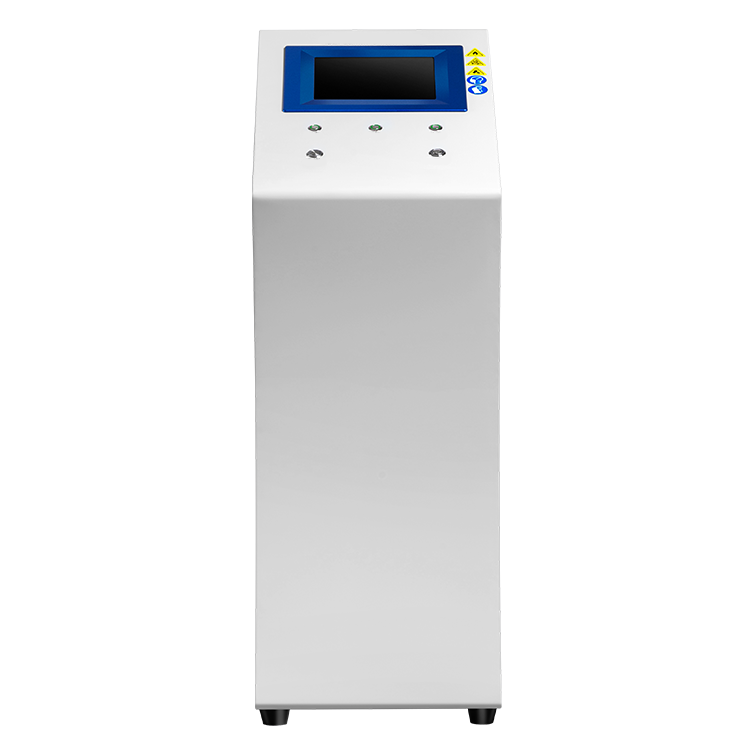
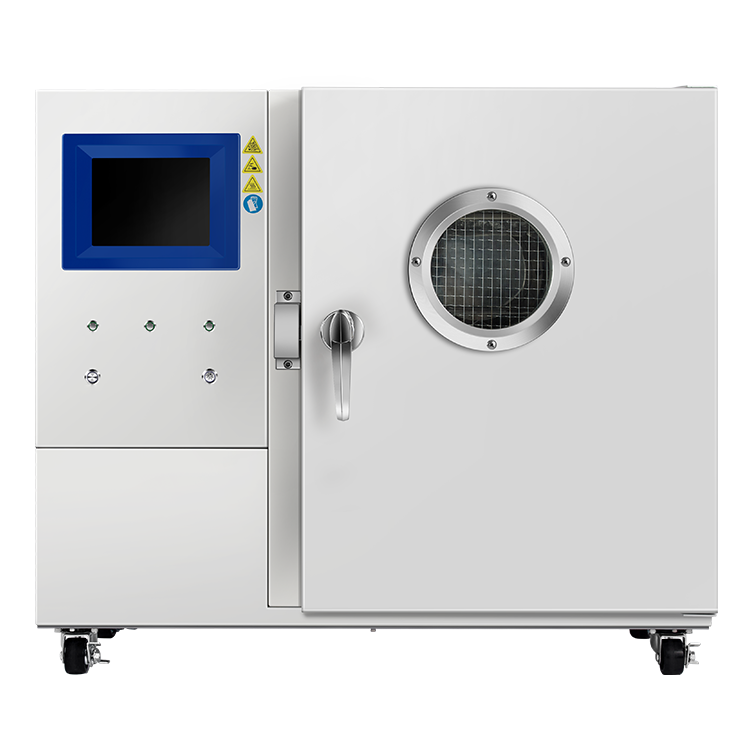
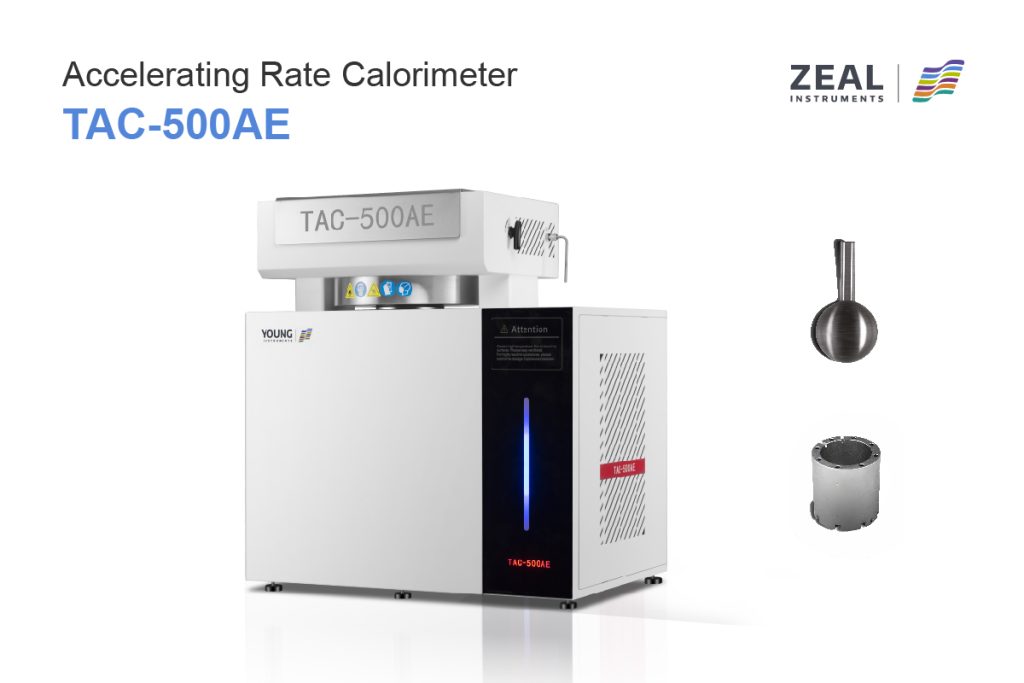
- Experimental instrument: TAC-500AE Accelerating Rate Calorimeter
- Operating mode: HWS mode
- Calorimetric bomb: volume 8 mL, hastelloy (specific heat capacity: 0.425 J·g⁻¹·K⁻¹)
- Glove box atmosphere exchange vacuum level: –0.085 MPa
- Protective atmosphere in glove box: nitrogen
- Number of atmosphere exchange cycles in glove box: 3
| Sample ID and Description | Calorimetric Bomb Mass (g) | Sample Mass (g) | Test Mode | Start Search Temperature (°C) | Wait Time at Search Temperature (min) | Step Size (°C) | Wait Time at Step (min) | Final Temperature (°C) |
| #0 Quartz Sand | – | – | Temperature Difference Baseline | 50 | 45 | 5 | 45 | 500 |
| #1 Medium-Nickel Cathode Material (50% SOC) + Electrolyte | 25.62 | 3.06(1.81g+0.996mL) | HWS | 50 | 45 | 5 | 45 | 500 |
| #2 High-Nickel Cathode Material (50% SOC) + Electrolyte | 25.87 | 2.42(1.44g+0.792mL) | HWS | 50 | 45 | 5 | 45 | 500 |
| #3 High-Nickel Cathode Material (50% SOC) | 25.93 | 2.06 | HWS | 50 | 45 | 5 | 45 | 500 |
| #4 Electrolyte | 25.95 | 2.33 | HWS | 50 | 45 | 5 | 45 | 500 |
Testing Procedure
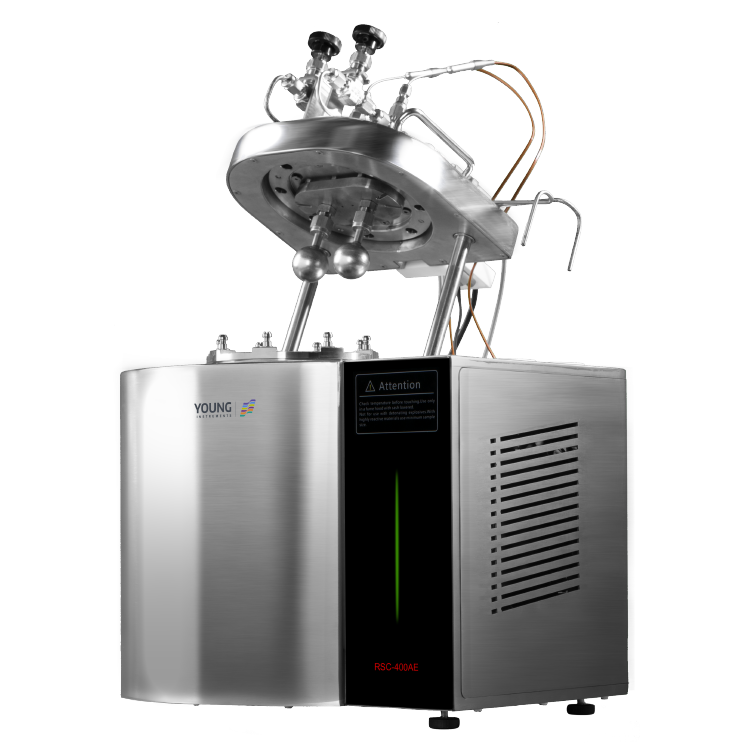
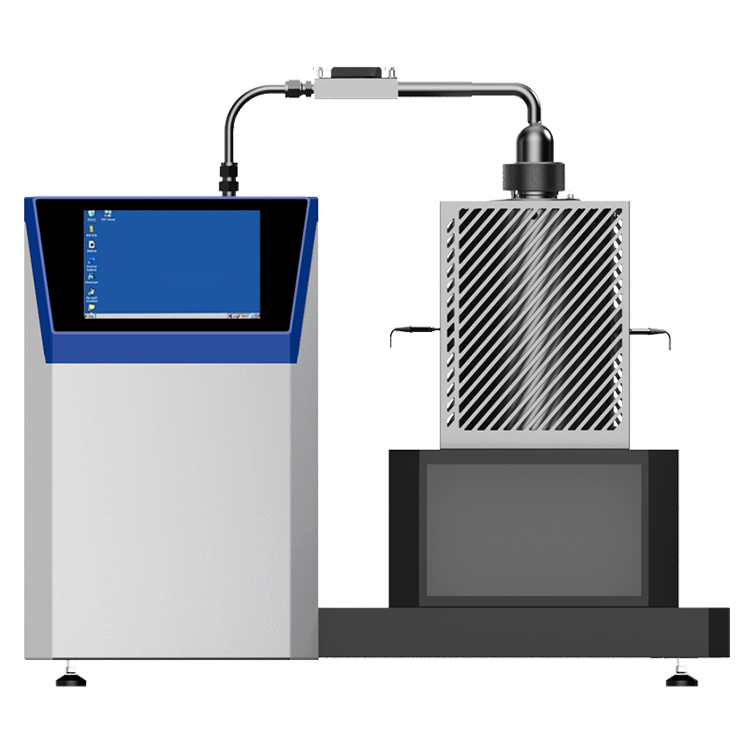
The calorimetric bomb was weighed inside the glove box, and a specified amount of sample was loaded. The bomb was then sealed by welding with a pressure-tight tube and connector assembly. As shown in Figure 2, the assembled calorimetric bomb was installed in the Accelerating Rate Calorimeter. After setting the experimental parameters (see Table 1), the test was initiated.
Experimental Results
Cathode Material, Electrolyte, and Their Mixture
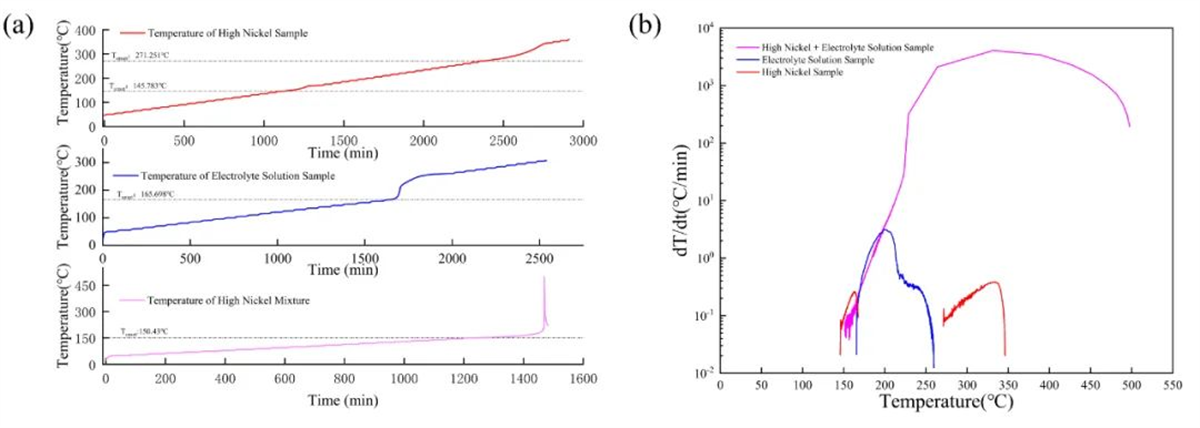
The thermal decomposition and exothermic characteristics of the high-nickel cathode material at 50% SOC, the electrolyte, and their mixture are shown in Figure 3. The self-heating onset temperature of the cathode material was 145.78℃, while that of the electrolyte was slightly higher at 165.70℃. As a result, the mixture of the two exhibited an intermediate self-heating onset temperature of 150.43℃. Additionally, a second exothermic reaction was detected in the single-component cathode material, with an onset temperature of 271.25℃. Furthermore, a severe reaction was observed between the high-nickel cathode material and the electrolyte, exhibiting a maximum self-heating rate of 485.37°C/min. In contrast, the maximum self-heating rates of the individual cathode material or electrolyte alone did not exceed 5℃/min. These findings are consistent with previous literature reports.
Blends of Different Cathode Materials with Electrolyte
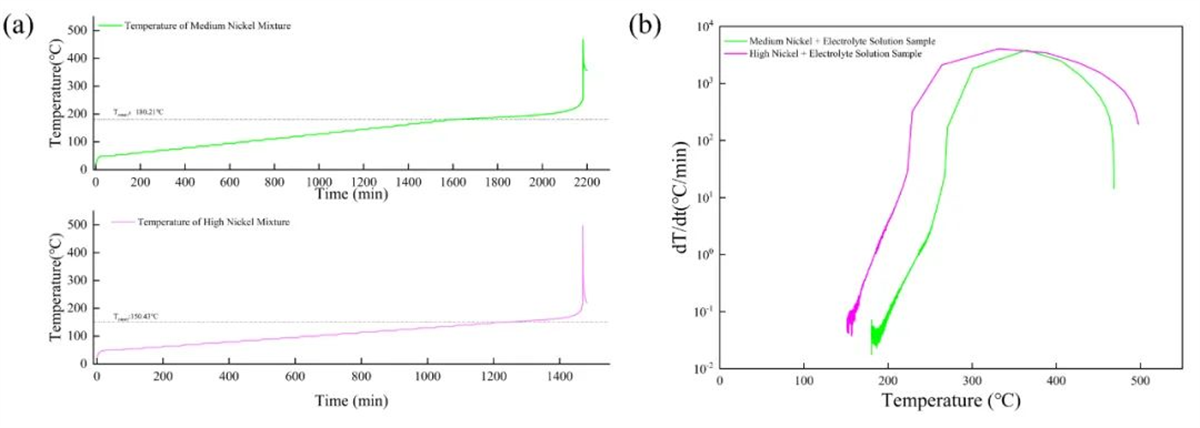
As shown in Figure 4 and Table 2, the self-heating onset temperature of the mixture with medium-nickel cathode material at 50% SOC and electrolyte was higher than that of the high-nickel material mixture. Meanwhile, the maximum reaction temperature and maximum self-heating rate of the medium-nickel mixture were lower than those of the high-nickel blend, indicating the relatively lower thermal stability of the high-nickel cathode material.
样本编号与名称 | Reaction onset temperature | Maximum reaction temperature | Maximum rate of temperature rise | Reaction heat release per unit mass | Thermal inertness factor |
#1 50%SOC medium nickel cathode material+electrolyte | 180.21 | 468.59 | 378.37 | 1178.35 | 2.04 |
#2 50%SOC high nickel cathode material+electrolyte | 150.43 | 497.72 | 485.37 | 1625.91 | 2.34 |
#3 50%SOC high nickel cathode material | 145.78 | 167.58 | 0.26 | 112.54 | 2.58 |
271.25 | 345.92 | 0.38 | 385.53 | ||
#4 Electrolyte | 165.70 | 260.18 | 3.15 | 453.51 | 2.40 |
Kinetic Parameter Fitting
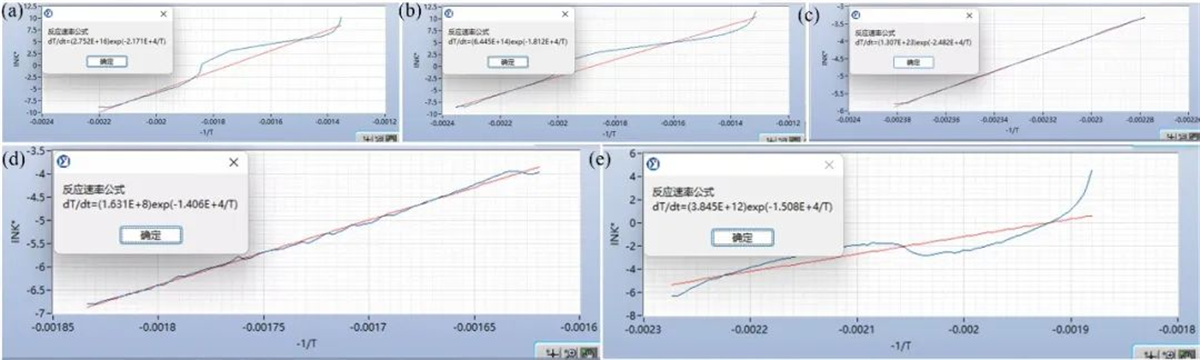
The kinetic parameters were fitted using the kinetic analysis module in the TAC-500AE data analysis software based on the adiabatic temperature rise curves obtained from the experiments. The optimal fitting results are shown in Figure 5 and Table 3.
|
Sample number and name |
Optimum grade |
Activation energy E(J/mol) |
Finger forward factor Aa(s-1) |
|
#1 50%SOC medium nickel cathode material+electrolyte |
2.30 |
1.805E+5 |
4.587E+14 |
|
#2 50%SOC high nickel cathode material+electrolyte |
3.00 |
1.507E+5 |
1.074E+13 |
|
#3 50%SOC high nickel cathode material |
0.50 |
2.06E+5 |
2.18E+21 |
|
0.60 |
1.17E+5 |
2.76E+6 | |
|
#4 Electrolyte |
3.00 |
1.25E+5 |
6.41E+10 |
Experimental Result
The TAC-500AE Accelerating Rate Calorimeter enables efficient and accurate measurement of the thermal stability parameters of battery materials. Deriving reaction kinetic equations through data fitting provides valuable support to researchers in cell development and safety optimization.

